Newmont Corporation (NYSE: NEM): Riding the Gold Wave With a 20%+ Rally
1. Company
Snapshot
- Founded: 1921
(over a century in mining)
- Headquarters:
Denver, Colorado
- Ticker: NEM
(NYSE)
- Sector:
Materials – Gold & Copper Mining
- Market
Cap: ~$45 billion
- Dividend
Yield: ~3% (among the highest in the sector)
- Mines
& Assets: Operations across North America, South
America, Africa, and Australia.
Newmont’s scale makes it the largest
publicly traded gold producer globally, with an annual output exceeding 6
million ounces. Its diversified asset base, combined with disciplined capital
allocation, provides resilience in volatile commodity cycles.
2. Macro
Backdrop – Why Gold Matters Now
- Gold
Above $2,500/oz – Gold has rallied to historic highs,
supported by:
- The
U.S. Federal Reserve preparing rate cuts.
- Persistent
inflation fears.
- Geopolitical
tensions in Europe, the Middle East, and Asia.
- Weakening
Dollar – A softer USD makes gold more
attractive globally.
- Institutional
Flows – ETFs and central banks have increased
gold holdings, boosting demand.
Gold’s unique role as both a store of value
and a hedge against uncertainty means miners like Newmont directly
benefit when investors seek safety.
3. Earnings
& Financial Strength
- Q2
FY2025 Revenue: ~$4.1B, +11% YoY
- Operating
Margin: ~24% (expanded from ~20% YoY)
- Net
Debt / EBITDA: ~1.4x (low vs. peers)
- Free
Cash Flow (FCF): Robust, thanks to higher realized gold
prices.
- Dividend
Policy: Progressive payout tied to gold price
bands → currently yielding ~3%.
This structure allows Newmont to reward
shareholders while maintaining flexibility during downturns.
4. Peer
Comparison
- Barrick
Gold (GOLD): Lower costs, but smaller production
base.
- Agnico
Eagle (AEM): Strong Canadian focus, less diversified
globally.
- Newmont
(NEM): Largest global footprint, higher
leverage to gold prices, stable dividend policy.
Result: NEM offers scale + yield, a
combination hard to find in the gold space.
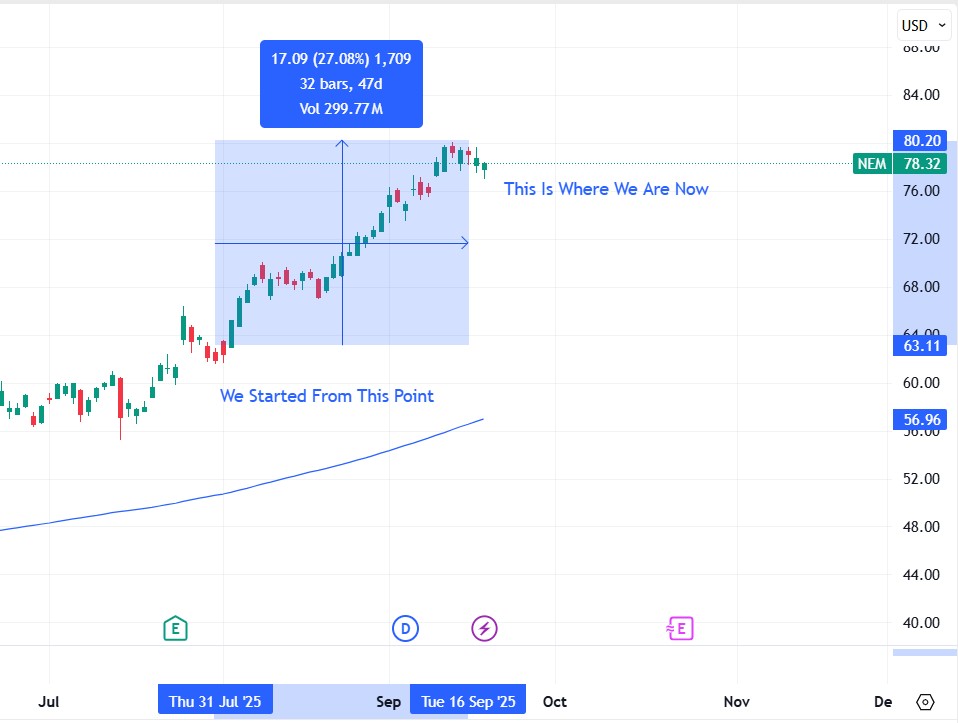
5.
Technical Analysis – Momentum in Play
📊 Insert
charts here (1M, 6M, 1Y)
- 1-Month: +20%
rally from ~$154 to ~$185.
- Trend: Above
both 50-day and 200-day moving averages → bullish.
- Support
Zone: $164 (previous base).
- Resistance
Levels: $185 (short-term), then $200
psychological barrier.
- RSI:
Recently above 70 (overbought zone), suggesting potential short-term
pullbacks but strong momentum overall.
6. What
Could Drive the Next Move?
Bullish Catalysts:
- Gold
sustaining above $2,400/oz.
- Continued
Fed easing cycle in late 2025.
- Stable
operations across key mines (especially Nevada Gold Mines JV).
Bearish Risks:
- Sharp
correction in gold prices if Fed policy changes.
- Rising
operational costs (energy, labor).
- Currency
fluctuations (USD strength hurting gold).
7.
Investment Lens
- For
Long-Term Investors: Newmont offers a rare mix of scale,
yield, and gold exposure.
- For
Traders: The recent breakout above $180 opens
upside toward $200 if momentum holds.
- For
Risk-Averse Investors: Dividend support provides stability, but
gold volatility should not be underestimated.
8.
Conclusion
Newmont’s latest rally highlights its leverage
to the global gold cycle. As macroeconomic uncertainty persists, investors are
once again turning to gold — and by extension, to Newmont as the go-to proxy
for bullion exposure.
If gold prices remain near record highs,
Newmont could see another leg higher. But with shares now technically
overbought, a measured approach — potentially scaling in — may be the smarter
strategy.
⚠️ Disclaimer:
This article is for educational and informational purposes only. It is not
financial advice and should not be considered a recommendation to buy,
sell, or hold any securities. Always consult with a licensed financial advisor
before making investment decisions.