One Green Day After a Market Crash: Has Sentiment Really Changed, or Is It Just a Relief Rally?
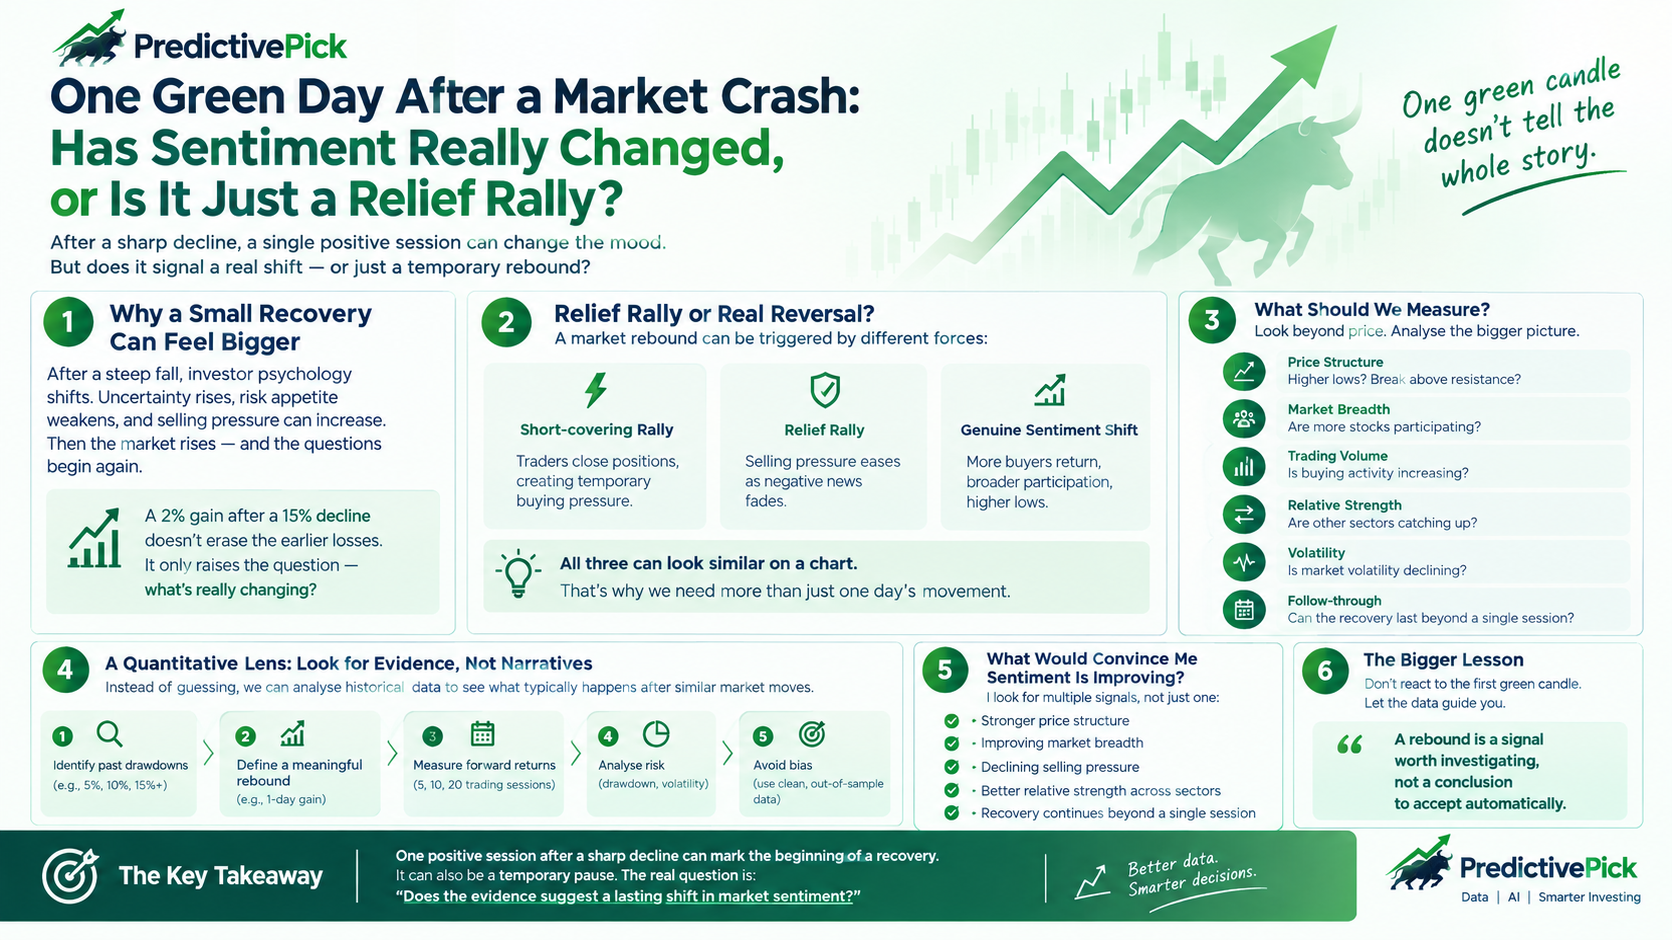
After a sharp decline in the Indian stock market, even one strong trading session can change the mood.
Yesterday, the market moved higher after a period of significant downside. Investors who were worried about further losses may now be wondering whether the worst is behind us.
Some may see the recovery as a buying opportunity. Others may remain cautious, expecting another round of selling.
But from a quantitative research perspective, I believe there is a more important question to ask:
Does one positive trading session indicate a genuine change in market sentiment, or is it simply a temporary rebound within a broader downtrend?
The difference matters.
1. Why a Small Recovery Can Feel Bigger After a Large Drawdown
Market psychology is heavily influenced by the direction of recent price movements.
When stocks fall for several consecutive sessions, uncertainty increases. Investors become more sensitive to negative news, risk appetite weakens, and selling pressure can accelerate.
Then the market rises.
Suddenly, the narrative begins to change.
Investors start asking whether valuations have become attractive, whether selling has gone too far, or whether the market has already priced in the bad news.
But a rebound after a sharp decline needs to be viewed in context.
A 2% gain following a 15% decline does not erase the earlier losses. Nor does it establish that the market has entered a new uptrend.
The size of the recovery is only one part of the story. What matters is whether the underlying market behaviour is changing.
2. A Relief Rally and a Trend Reversal Are Not the Same Thing
There are several possible explanations for a market rebound after a significant decline.
Scenario 1: Short-covering rally
Traders who had positioned for further downside close their positions, creating temporary buying pressure.
Prices rise, but the underlying demand for equities may not have improved materially.
Scenario 2: Relief rally
Investors react positively to the absence of further negative news. Selling pressure eases, and prices recover from oversold conditions.
This can provide temporary relief without changing the broader trend.
Scenario 3: Genuine improvement in market sentiment
Buyers begin returning with greater conviction. More stocks participate in the recovery, selling pressure weakens, and the market starts establishing higher lows.
This may indicate a more durable shift, although it still requires confirmation.
The challenge is that all three scenarios can initially look similar on a price chart.
That is why reacting to a single session can be misleading.
3. What Should We Measure Before Declaring a Sentiment Shift?
Instead of relying on one day's movement, I would examine several indicators together.
A. Price structure
Is the index simply bouncing from a recent low, or is it beginning to form higher lows and break above meaningful resistance levels?
A recovery that fails near resistance may indicate that sellers remain in control.
B. Market breadth
Are most stocks participating in the recovery, or are only a handful of large-cap companies lifting the index?
A broader advance can provide stronger evidence of improving participation than an index rally driven by a few heavyweights.
C. Trading volume
Is buying activity increasing as prices recover?
Volume can help provide context, although high volume alone does not establish whether a move is sustainable.
D. Relative strength
Are stocks and sectors that previously showed weakness beginning to outperform?
A wider improvement in relative strength may suggest that the recovery is spreading beyond a small group of stocks.
E. Volatility
Is Volatility" title="More analysis on Market Volatility">market volatility beginning to decline, or are large daily swings continuing?
A reduction in volatility may indicate stabilisation, but it does not guarantee that prices will continue rising.
F. Follow-through
Perhaps the most important question is whether the market can sustain the recovery over subsequent sessions.
A single positive session is an observation. Consistent follow-through provides additional evidence.
No single indicator is conclusive. The combination matters.
4. The Quantitative Research Perspective: Look for Evidence, Not Narratives
This is where quantitative analysis becomes particularly useful.
Instead of deciding that the market has turned bullish because it rose yesterday, we can define measurable conditions and test what historically happened after similar market events.
For example, consider the following research question:
When the Nifty 50 experiences a significant drawdown and then records a strong positive session, what tends to happen over the next 5, 10 and 20 trading sessions?
That question can be investigated using historical market data.
A structured study could follow these steps:
Identify historical periods when the index experienced a predefined drawdown.
Define what qualifies as a meaningful rebound.
Measure forward returns over the next 5, 10 and 20 trading sessions.
Calculate the percentage of cases with positive forward returns.
Compare outcomes with periods that did not meet the rebound conditions.
Evaluate maximum subsequent drawdown and downside risk.
Test the findings across different market regimes.
The objective would not be to prove that every rebound leads to a recovery.
It would be to determine whether a particular combination of conditions has historically provided useful information.
Importantly, the research should account for transaction costs where relevant, avoid look-ahead bias, and separate the period used to develop a hypothesis from the period used to test it.
Otherwise, it is easy to find patterns in historical data that do not hold up in practice.
5. The Most Interesting Question May Not Be Whether the Market Rises Tomorrow
Investors naturally want to know whether the market will rise or fall next.
But from a research perspective, another question may be more useful:
After a sharp decline, does the probability distribution of future returns change when the market begins to recover?
There is a difference between predicting a particular outcome and identifying a change in probabilities.
A rebound may improve the probability of a short-term recovery without eliminating the risk of another decline.
Likewise, a market can remain volatile even after a genuine improvement in sentiment begins.
The goal of quantitative research is not to remove uncertainty. It is to measure it more systematically.
6. What Would Convince Me That Sentiment Is Actually Improving?
I would not draw that conclusion from one green candle alone.
I would look for evidence that several conditions are improving together:
The index begins establishing a stronger price structure.
Market breadth improves and more stocks participate.
Selling pressure becomes less persistent.
Relative strength improves across more sectors.
The recovery continues beyond a single session.
Historical testing suggests that similar conditions have provided useful signals.
Even then, these observations would support a hypothesis rather than guarantee a market reversal.
Markets can recover and decline again. They can also turn upward before every indicator confirms the move.
There is no perfectly reliable signal that identifies the bottom in real time.
That is precisely why risk management matters.
7. The Bigger Lesson for Investors
After a large drawdown, investors can become trapped between two reactions.
Some sell because they expect further losses. Others buy aggressively because they believe the market has reached its bottom.
Both decisions can be driven more by emotion than evidence.
A more disciplined approach is to distinguish between what the market has already done, what current indicators suggest, and what historical data can reasonably tell us about possible future outcomes.
A rebound is a signal worth investigating, not a conclusion to accept automatically.
The important question is not simply whether the market went up yesterday.
It is whether the evidence suggests that the balance between buyers and sellers, the breadth of participation, and the distribution of future risk are beginning to change.
That is a much more interesting question than trying to predict the next day's candle.
My takeaway as a quant researcher
One positive session after a sharp market decline can mark the beginning of a recovery. It can also be a temporary pause before further weakness.
The price movement itself does not tell us which scenario we are experiencing.
We need to examine the data, test the hypothesis, measure the risk, and remain open to being wrong.
In markets, the first rebound attracts attention. The evidence that follows determines whether it deserves our confidence.
What do you think: after a sharp drawdown, do you pay more attention to the first recovery session, or to the confirmation that follows?